Introduction
JITWatch, the HotSpot JIT compilation visualiser contains a static bytecode analysis tool named JarScan.
JarScan accepts a list of jar files and examines the bytecode instructions of each method, performing an operation that implements the interface:
public interface IJarScanOperation
{
void processInstructions(String className, MemberBytecode memberBytecode);
}
{
void processInstructions(String className, MemberBytecode memberBytecode);
}
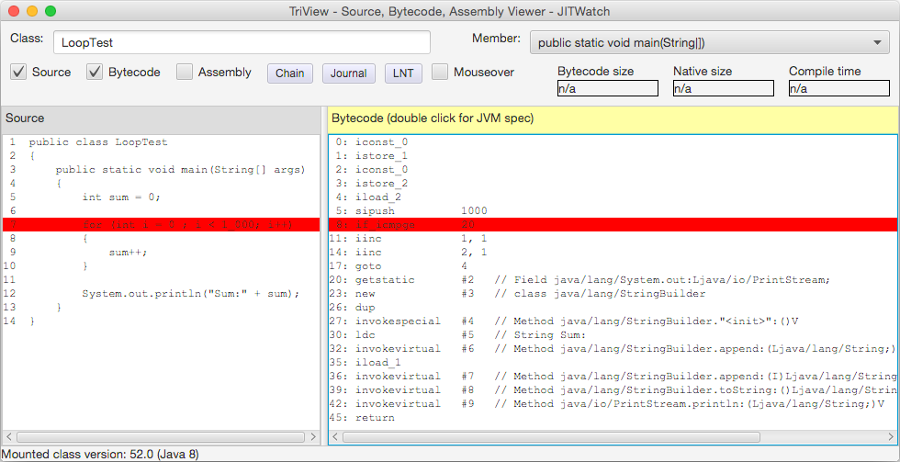
A basic understanding of how the JVM executes bytecode is useful for reading this blog post.
It may be helpful to have the JVM spec to hand: https://docs.oracle.com/javase/specs/jvms/se8/html/
Clicking on a bytecode instruction opens its definition in the JVM specification.
Usage
Here is the JarScan usage:
JarScan --mode=<mode> [--packages=a,b,c,...] [params] <jars>
----------------------------------------------------------------------------------------------
Available modes:
----------------------------------------------------------------------------------------------
maxMethodSize List every method with bytecode larger than specified limit.
--limit=n Report methods larger than n bytes.
----------------------------------------------------------------------------------------------
sequenceCount Count instruction sequences.
--length=n Report sequences of length n.
----------------------------------------------------------------------------------------------
invokeCount Count the most called methods for each invoke instruction.
[--limit=n] Limit to top n results per invoke type.
----------------------------------------------------------------------------------------------
nextInstructionFreq List the most popular next instruction for each bytecode instruction.
[--limit=n] Limit to top n results per instruction.
----------------------------------------------------------------------------------------------
allocationCount Count the most allocated types.
[--limit=n] Limit to top n results.
----------------------------------------------------------------------------------------------
instructionCount Count occurences of each bytecode instruction.
[--limit=n] Limit to top n results.
----------------------------------------------------------------------------------------------
sequenceSearch List methods containing the specified bytecode sequence.
--sequence=a,b,c,... Comma separated sequence of bytecode instructions.
----------------------------------------------------------------------------------------------
Available modes:
----------------------------------------------------------------------------------------------
maxMethodSize List every method with bytecode larger than specified limit.
--limit=n Report methods larger than n bytes.
----------------------------------------------------------------------------------------------
sequenceCount Count instruction sequences.
--length=n Report sequences of length n.
----------------------------------------------------------------------------------------------
invokeCount Count the most called methods for each invoke instruction.
[--limit=n] Limit to top n results per invoke type.
----------------------------------------------------------------------------------------------
nextInstructionFreq List the most popular next instruction for each bytecode instruction.
[--limit=n] Limit to top n results per instruction.
----------------------------------------------------------------------------------------------
allocationCount Count the most allocated types.
[--limit=n] Limit to top n results.
----------------------------------------------------------------------------------------------
instructionCount Count occurences of each bytecode instruction.
[--limit=n] Limit to top n results.
----------------------------------------------------------------------------------------------
sequenceSearch List methods containing the specified bytecode sequence.
--sequence=a,b,c,... Comma separated sequence of bytecode instructions.
The JarScan Modes
NB: Some of the new JarScan operations are stateful and attempt to follow the bytecode instruction flow in the same way as the JVM's interpreter would. Since JarScan is a static analysis tool assumptions have had to be made about how to handle control flow when a conditional code is met.
JarScan control flow processes bytecode instructions sequentially except for:
- *return instructions end the current sequence. It is discarded if not of the required length.
- athrow also ends the current sequence, discarding if not the required length.
- invoke* instructions are not followed and proceed to the next instruction.
- goto, goto_w instructions (unconditional branches) are followed.
- if* instructions assume not taken and proceed to the next instruction.
- tableswitch, lookupswitch instructions proceed to the next instruction.
- jsr, jsr_w, ret instructions are not handled and the sequence is discarded.
- An instruction offset (BCI) can be visited only once per sequence to prevent infinite loops.
The degree to which these control flow limitations affect the results is unclear.
Following invoke instructions is a possible future enhancement.
The assumption that branches are not taken seems reasonable in the case of loops since the taken branch is usually the loop exit which is the uncommon case.
The code corpus
For this investigation, the class file corpus is the Java core libraries contained in rt.jar from Java 8 update 74 on Linux x86-64.
This is a 63M compressed jar file containing the following package size distribution:
javax 19M
java 20M
org 4M
sun 24M
com 48M
jdk 2M
java 20M
org 4M
sun 24M
com 48M
jdk 2M
A little snag
While verifying my results I discovered very unusual dominating bytecode sequences and on further investigation discovered that repeated code from *hundreds* of localisation classes was skewing the results.
com.sun.accessibility.internal.resources.accessibility_*.getContents()
com.sun.java.swing.plaf.gtk.resources.gtk_*.getContents()
com.sun.java.swing.plaf.motif.resources.motif_*.getContents()
com.sun.java.swing.plaf.windows.resources.windows_*.getContents()
com.sun.java.util.jar.pack.DriverResource_*.<clinit>()
com.sun.org.apache.xalan.internal.res.XSLTErrorResources_*.getContents()
com.sun.org.apache.xalan.internal.xsltc.compiler.util.ErrorMessages_*.getContents()
sun.awt.resources.awt_*.getContents()
sun.security.tools.policytool.Resources_*.<clinit>()
...
Where * in (en,fr,es,de,...)
To avoid this bias I added support to JarScan for filtering by package and have restated the results considering only classes from the package java.*
Recreating this investigation
Here are the JarScan commands executed to create these results:
#!/bin/sh
export JAR=/home/chris/jdk1.8.0_74/jre/lib/rt.jar
export PACKAGES=java.*
./jarScan.sh --mode=maxMethodSize --limit=325 --packages=$PACKAGES $JAR > results/freqInlineSize.csv
./jarScan.sh --mode=sequenceCount --length=2 --packages=$PACKAGES $JAR > results/sequence2.csv
./jarScan.sh --mode=sequenceCount --length=3 --packages=$PACKAGES $JAR > results/sequence3.csv
./jarScan.sh --mode=sequenceCount --length=4 --packages=$PACKAGES $JAR > results/sequence4.csv
./jarScan.sh --mode=sequenceCount --length=5 --packages=$PACKAGES $JAR > results/sequence5.csv
./jarScan.sh --mode=invokeCount --packages=$PACKAGES $JAR > results/invokeCount.csv
./jarScan.sh --mode=allocationCount --packages=$PACKAGES $JAR > results/allocationCount.csv
./jarScan.sh --mode=nextInstructionFreq --packages=$PACKAGES $JAR > results/nextInstruction.csv
./jarScan.sh --mode=instructionCount --packages=$PACKAGES $JAR > results/instructionCount.csv
./jarScan.sh --mode=sequenceSearch --sequence=iconst_2,newarray --packages=$PACKAGES $JAR > results/sequenceSearchExample.csv
Let's get started
maxMethodSize - Identify hot methods too large for inlining
This is the original functionality present in the JarScan tool.
The operation finds methods larger than the VM's JIT compiler limit for inlining of hot methods (default limit is 325 bytes on 64-bit Linux, overridden on command line using -XX:FreqInlineSize=n).
This operation can be useful in identifying methods that you would like to be inlined at runtime because they are important for performance but can't be because they have become too large and need refactoring.
./jarScan.sh --mode=maxMethodSize --limit=325 --packages=java.* rt.jar
Here are the top 10 methods in the java.* core packages that are above the default Linux 64-bit inlining threshold of 325 bytes for hot methods.
Hover over a method to view the full signature.
| Method | Bytecode Size |
|---|---|
| ComponentColorModel. | 3206 |
| GridBagLayout. | 2978 |
| KeyEvent. | 2455 |
| JapaneseImperialCalendar. | 2423 |
| ComponentColorModel. | 2118 |
| SimpleDateFormat. | 1765 |
| GregorianCalendar. | 1760 |
| Formatter$FormatSpecifier. | 1723 |
| CharacterData01. | 1675 |
| DecimalFormat. | 1591 |
Here are the 10 largest methods from the java.lang.* packages
| Method | Bytecode Size |
|---|---|
| BoundMethodHandle$Factory. | 1105 |
| DirectMethodHandle. | 1073 |
| AbstractValidatingLambdaMetafactory. | 864 |
| LambdaFormEditor. | 739 |
| MethodTypeForm. | 687 |
| MethodHandleImpl. | 679 |
| LambdaForm. | 679 |
| DirectMethodHandle. | 645 |
| Invokers. | 633 |
| ThreadInfo. | 616 |
And finally the 10 largest methods from the java.util.* packages
| Method | Bytecode Size |
|---|---|
| StampedLock. | 1233 |
| Pattern. | 1151 |
| Pattern. | 994 |
| ConcurrentHashMap. | 830 |
| Exchanger. | 684 |
| StampedLock. | 661 |
| ConcurrentSkipListMap. | 646 |
| ConcurrentHashMap. | 617 |
| XMLFormatter. | 615 |
| ConcurrentHashMap$TreeBin. | 575 |
Full data: Methods above 325 bytes of bytecode
Note that many of these methods will not be called in hot code and so would not benefit from inlining but there are a few surprises.
Take a look at java.lang.String's toUpperCase(Locale) and toLowerCase(Locale) weighing in at 439 bytes each, well above the default inlining limit.
For more information, see these previous blog posts:
sequenceCount - Count instruction sequences of a given length (NB: Attempts to follow bytecode)
Find all bytecode instruction sequences of the given length and count their occurrence.
This could help identify popular bytecode idioms and perhaps give an insight into the javac compiler or even some hints for possible JIT compiler optimisations.
Instruction sequences of length 2
./jarScan.sh --mode=sequenceCount --length=2 --packages=java.* rt.jar
| Instruction 1 | Instruction 2 | Count | Percent |
|---|---|---|---|
| aload_0 | getfield | 34018 | 4.67% |
| new | dup | 16337 | 2.24% |
| aload_0 | aload_1 | 8489 | 1.17% |
| putfield | aload_0 | 8066 | 1.11% |
| aload_0 | invokevirtual | 8026 | 1.10% |
| invokespecial | athrow | 6429 | 0.88% |
| dup | invokespecial | 6338 | 0.87% |
| aload_1 | invokevirtual | 6209 | 0.85% |
Here we can see that the most popular 2-instruction sequence is aload_0, getfield.
- aload_n pushes a reference onto the stack (aload_0 is most likely referring to "this").
- getfield is accessing a field on the pushed object.
I believe that the top 2-instruction sequence is accessing a field on "this".
Full data: Sequences of length 2
Instruction sequences of length 3
./jarScan.sh --mode=sequenceCount --length=3 --packages=java.* rt.jar
| Instruction 1 | Instruction 2 | Instruction 3 | Count | Percent |
|---|---|---|---|---|
| new | dup | invokespecial | 6338 | 0.93% |
| aload_0 | getfield | invokevirtual | 4054 | 0.60% |
| new | dup | ldc | 3304 | 0.49% |
| aload_0 | getfield | aload_0 | 2805 | 0.41% |
| dup | invokespecial | athrow | 2678 | 0.39% |
| getfield | aload_0 | getfield | 2551 | 0.38% |
| dup | ldc | invokespecial | 2367 | 0.35% |
| ldc | invokespecial | athrow | 2135 | 0.31% |
Here we can see that the most popular 3-instruction sequence is new, dup, invokespecial.
- new allocates a new object.
- dup duplicates it to prevent it being popped off the stack.
- invokespecial is probably a constructor call.
I believe the top 3-instruction sequence is an object allocation and constructor call.
Full data: Sequences of length 3
Instruction sequences of length 4
./jarScan.sh --mode=sequenceCount --length=4 --packages=java.* rt.jar
| Instruction 1 | Instruction 2 | Instruction 3 | Instruction 4 | Count | Percent |
|---|---|---|---|---|---|
| new | dup | invokespecial | athrow | 2678 | 0.42% |
| new | dup | ldc | invokespecial | 2367 | 0.37% |
| aload_0 | getfield | aload_0 | getfield | 2214 | 0.35% |
| dup | ldc | invokespecial | athrow | 2106 | 0.33% |
| new | dup | invokespecial | ldc | 1531 | 0.24% |
| dup | invokespecial | ldc | invokevirtual | 1523 | 0.24% |
| invokespecial | putstatic | new | dup | 1088 | 0.17% |
| aload_0 | aload_1 | putfield | aload_0 | 1079 | 0.17% |
Here we can see that the most popular 4-instruction sequence is new, dup, invokespecial, athrow.
- new allocates a new object.
- dup duplicates it to prevent it being popped off the stack.
- invokespecial is probably a constructor call.
- athrow throws an exception.
I believe the top 4-instruction sequence is the object allocation, constructor call, and throwing of an exception.
Full data: Sequences of length 4
Instruction sequences of length 5
./jarScan.sh --mode=sequenceCount --length=5 --packages=java.* rt.jar
| Instruction 1 | Instruction 2 | Instruction 3 | Instruction 4 | Instruction 5 | Count | Percent |
|---|---|---|---|---|---|---|
| new | dup | ldc | invokespecial | athrow | 2106 | 0.36% |
| new | dup | invokespecial | ldc | invokevirtual | 1523 | 0.26% |
| new | dup | new | dup | invokespecial | 980 | 0.17% |
| aastore | dup | sipush | ldc | aastore | 887 | 0.15% |
| dup | sipush | ldc | aastore | dup | 886 | 0.15% |
| sipush | ldc | aastore | dup | sipush | 886 | 0.15% |
| dup | new | dup | invokespecial | ldc | 854 | 0.14% |
| aastore | dup | sipush | ldc_w | aastore | 696 | 0.12% |
Here we can see that the most popular 5-instruction sequence is new, dup, ldc, invokespecial, athrow.
- new allocates a new object.
- dup duplicates it to prevent it being popped off the stack.
- ldc loads a constant from the constant pool.
- invokespecial is probably a constructor call.
- athrow throws an exception.
I believe the top 5-instruction sequence is the object allocation, load error message String constant, constructor call with error message, and throwing of an exception.
Full data: Sequences of length 5
If you want to explore these sequences further and find out what kind of source code they are compiled from then this next JarScan mode can help.
sequenceSearch - Find methods containing a given bytecode instruction sequence (NB: Attempts to follow bytecode)
Find all methods that contain the specified comma separated sequence of bytecode instructions.
For example, to find all methods that instantiate a primitive array (any primitive type) of constant length 2 you would search for the instruction sequence:
iconst_2 // push integer constant 2 onto the stack
newarray // create a primitive array
newarray // create a primitive array
./jarScan.sh --mode=sequenceSearch --sequence=iconst_2,newarray --packages=java.* rt.jar
Here are the results, filtered to just the java.lang package.
| Method containing sequence | Bytecode offset |
|---|---|
| java.lang.Character.toChars(int) | 23 |
| java.lang.CharacterData00.<clinit>() | 1005 |
| java.lang.CharacterData00.<clinit>() | 1043 |
| java.lang.CharacterData00.<clinit>() | 1081 |
| java.lang.CharacterData00.<clinit>() | 1119 |
| java.lang.CharacterData00.<clinit>() | 1157 |
| java.lang.CharacterData00.<clinit>() | 1195 |
| java.lang.CharacterData00.<clinit>() | 1233 |
| java.lang.CharacterData00.<clinit>() | 1271 |
| java.lang.CharacterData00.<clinit>() | 1309 |
Full data: All sequences of iconst_2,newarray
Back to the source code
Taking java.lang.Character.toChars(int) as an example we can use the javap command line tool to output the bytecode for this method and see the matching sequence starting at offset 23
javap -v java.lang.Character
public static char[] toChars(int);
descriptor: (I)[C
flags: ACC_PUBLIC, ACC_STATIC
Code:
stack=4, locals=2, args_size=1
0: iload_0
1: invokestatic #27 // Method isBmpCodePoint:(I)Z
4: ifeq 16
7: iconst_1
8: newarray char
10: dup
11: iconst_0
12: iload_0
13: i2c
14: castore
15: areturn
16: iload_0
17: invokestatic #28 // Method isValidCodePoint:(I)Z
20: ifeq 35
23: iconst_2
24: newarray char
26: astore_1
27: iload_0
28: aload_1
29: iconst_0
30: invokestatic #29 // Method toSurrogates:(I[CI)V
33: aload_1
34: areturn
35: new #30 // class java/lang/IllegalArgumentException
38: dup
39: invokespecial #31 // Method java/lang/IllegalArgumentException."<init>":()V
42: athrow
Looking at the source code for java.lang.Character.toChars(int) we can see the Java source code allocates an integer array of size 2.
public static char[] toChars(int codePoint) {
if (isBmpCodePoint(codePoint)) {
return new char[] { (char) codePoint };
} else if (isValidCodePoint(codePoint)) {
char[] result = new char[2];
toSurrogates(codePoint, result, 0);
return result;
} else {
throw new IllegalArgumentException();
}
}
if (isBmpCodePoint(codePoint)) {
return new char[] { (char) codePoint };
} else if (isValidCodePoint(codePoint)) {
char[] result = new char[2];
toSurrogates(codePoint, result, 0);
return result;
} else {
throw new IllegalArgumentException();
}
}
invokeCount - Find the most invoked methods for each kind of invoke
For each invoke instruction (invokedynamic, invokeinterface, invokespecial, invokestatic, invokevirtual) count the most invoked methods.
NB: Static analysis can only count the call sites. It cannot tell you which invocations will occur at runtime.
./jarScan.sh --mode=invokeCount --packages=java.* rt.jar
Here are the most invoked methods in the core java.* packages.
| Invoke | Method | Count | Percent |
|---|---|---|---|
| invokevirtual | java.lang.StringBuilder.append(java.lang.String) | 5600 | 10.81% |
| invokevirtual | java.lang.StringBuilder.toString() | 2345 | 4.53% |
| invokevirtual | java.lang.StringBuilder.append(int) | 822 | 1.59% |
| invokevirtual | java.lang.StringBuilder.append(java.lang.Object) | 697 | 1.35% |
| invokevirtual | java.lang.String.length() | 686 | 1.32% |
| invokevirtual | java.lang.StringBuilder.append(char) | 518 | 1.00% |
| invokevirtual | java.lang.String.equals(java.lang.Object) | 510 | 0.98% |
| invokevirtual | java.lang.Object.getClass() | 503 | 0.97% |
| Invoke | Method | Count | Percent |
|---|---|---|---|
| invokespecial | java.lang.StringBuilder.<init>() | 2298 | 8.11% |
| invokespecial | java.lang.Object.<init>() | 1735 | 6.13% |
| invokespecial | java.lang.IllegalArgumentException.<init>(java.lang.String) | 1166 | 4.12% |
| invokespecial | java.lang.AssertionError.<init>() | 872 | 3.08% |
| invokespecial | java.lang.NullPointerException.<init>() | 497 | 1.75% |
| invokespecial | java.lang.NullPointerException.<init>(java.lang.String) | 239 | 0.84% |
| invokespecial | java.nio.ReadOnlyBufferException.<init>() | 193 | 0.68% |
| invokespecial | java.net.SocketException.<init>(java.lang.String) | 189 | 0.67% |
| Invoke | Method | Count | Percent |
|---|---|---|---|
| invokestatic | java.lang.System.arraycopy(java.lang.Object,int,java.lang.Object,int,int) | 401 | 2.32% |
| invokestatic | java.util.Objects.requireNonNull(java.lang.Object) | 371 | 2.15% |
| invokestatic | java.lang.Integer.valueOf(int) | 256 | 1.48% |
| invokestatic | java.util.Objects.requireNonNull(java.lang.Object,java.lang.String) | 255 | 1.48% |
| invokestatic | java.lang.System.getSecurityManager() | 235 | 1.36% |
| invokestatic | java.security.AccessController.doPrivileged(java.security.PrivilegedAction) | 192 | 1.11% |
| invokestatic | java.lang.Thread.currentThread() | 174 | 1.01% |
| invokestatic | java.lang.Math.min(int,int) | 170 | 0.98% |
| Invoke | Method | Count | Percent |
|---|---|---|---|
| invokeinterface | java.util.Iterator.hasNext() | 420 | 5.20% |
| invokeinterface | java.util.Iterator.next() | 419 | 5.19% |
| invokeinterface | java.util.Map.put(java.lang.Object,java.lang.Object) | 274 | 3.39% |
| invokeinterface | java.util.Map.get(java.lang.Object) | 218 | 2.70% |
| invokeinterface | java.util.Set.iterator() | 157 | 1.94% |
| invokeinterface | java.util.Map$Entry.getKey() | 149 | 1.84% |
| invokeinterface | java.util.Map$Entry.getValue() | 137 | 1.70% |
| invokeinterface | java.util.List.add(java.lang.Object) | 126 | 1.56% |
| Invoke | Method | Count | Percent |
|---|---|---|---|
| invokedynamic | java.util.stream.Collectors.apply() | 30 | 8.50% |
| invokedynamic | java.util.stream.Collectors.get() | 19 | 5.38% |
| invokedynamic | java.time.temporal.TemporalQueries.queryFrom() | 7 | 1.98% |
| invokedynamic | java.time.chrono.AbstractChronology.compare() | 6 | 1.70% |
| invokedynamic | java.time.temporal.TemporalAdjusters.adjustInto() | 6 | 1.70% |
| invokedynamic | java.util.stream.Collectors.accept() | 6 | 1.70% |
| invokedynamic | java.util.stream.DoublePipeline.accept() | 6 | 1.70% |
| invokedynamic | java.util.stream.LongPipeline.applyAsLong() | 5 | 1.42% |
Full data: Invocation Counts
allocationCount - Find the most allocated types for each kind of allocation instruction
For each allocation instruction (new, newarray, anewarray, multianewarray) count the most allocated types.
NB: Static analysis can only find the allocation sites. It cannot tell you which allocations will actually occur at runtime.
./jarScan.sh --mode=allocationCount --packages=java.* rt.jar
Here are the most allocated types in the core java.* packages.
| Instruction | Type | Count | Percent |
|---|---|---|---|
| new | java.lang.StringBuilder | 2361 | 14.45% |
| new | java.lang.IllegalArgumentException | 1325 | 8.11% |
| new | java.lang.AssertionError | 1041 | 6.37% |
| new | java.lang.NullPointerException | 736 | 4.51% |
| new | java.lang.UnsupportedOperationException | 257 | 1.57% |
| new | java.lang.IllegalStateException | 224 | 1.37% |
| new | java.lang.Character$UnicodeBlock | 221 | 1.35% |
| new | java.nio.ReadOnlyBufferException | 193 | 1.18% |
| Instruction | Type | Count | Percent |
|---|---|---|---|
| newarray | int | 496 | 35.89% |
| newarray | char | 365 | 26.41% |
| newarray | byte | 215 | 15.56% |
| newarray | float | 105 | 7.60% |
| newarray | double | 80 | 5.79% |
| newarray | long | 66 | 4.78% |
| newarray | short | 43 | 3.11% |
| newarray | boolean | 12 | 0.87% |
| Instruction | Type | Count | Percent |
|---|---|---|---|
| anewarray | java.lang.Object | 479 | 30.22% |
| anewarray | java.lang.String | 286 | 18.04% |
| anewarray | java.lang.Class | 118 | 7.44% |
| anewarray | [C | 103 | 6.50% |
| anewarray | java.io.ObjectStreamField | 30 | 1.89% |
| anewarray | java.nio.file.LinkOption | 19 | 1.20% |
| anewarray | java.lang.invoke.LambdaForm$Name | 16 | 1.01% |
| anewarray | java.lang.management.PlatformComponent | 16 | 1.01% |
| Instruction | Type | Count | Percent |
|---|---|---|---|
| multianewarray | [[I | 4 | 40.00% |
| multianewarray | [[B | 1 | 10.00% |
| multianewarray | [[D | 1 | 10.00% |
| multianewarray | [[F | 1 | 10.00% |
| multianewarray | [[Ljava.lang.annotation.Annotation; | 1 | 10.00% |
| multianewarray | [[Ljava.lang.invoke.LambdaForm$Name; | 1 | 10.00% |
| multianewarray | [[S | 1 | 10.00% |
Full data: Allocations by Type
instructionCount - Count the occurrences of each bytecode instruction
NB: Static analysis can only count the occurrences of each instruction. It cannot tell you which instructions will be executed at runtime.
./jarScan.sh --mode=instructionCount --packages=java.* rt.jar
Here are the instructions counts from the core java.* packages.
| Instruction | Count | Percent |
|---|---|---|
| aload_0 | 83800 | 10.80% |
| invokevirtual | 51780 | 6.67% |
| getfield | 42103 | 5.42% |
| aload_1 | 32025 | 4.13% |
| dup | 29604 | 3.81% |
| invokespecial | 28320 | 3.65% |
| iload | 25672 | 3.31% |
| aload | 24747 | 3.19% |
| goto | 18285 | 2.36% |
| invokestatic | 17277 | 2.23% |
| new | 16337 | 2.10% |
| aload_2 | 16283 | 2.10% |
| areturn | 15829 | 2.04% |
| ldc | 15662 | 2.02% |
| iconst_0 | 15436 | 1.99% |
| putfield | 15181 | 1.96% |
| iconst_1 | 13594 | 1.75% |
| return | 12525 | 1.61% |
| getstatic | 11666 | 1.50% |
| bipush | 11402 | 1.47% |
| astore | 11090 | 1.43% |
| istore | 10878 | 1.40% |
| ifeq | 9878 | 1.27% |
| aload_3 | 9864 | 1.27% |
| ireturn | 9798 | 1.26% |
| iload_2 | 9786 | 1.26% |
| iload_1 | 9491 | 1.22% |
| athrow | 8328 | 1.07% |
| invokeinterface | 8077 | 1.04% |
| iload_3 | 7998 | 1.03% |
| ifne | 6638 | 0.86% |
| sipush | 6479 | 0.83% |
| aastore | 6244 | 0.80% |
| ifnull | 6177 | 0.80% |
| checkcast | 5948 | 0.77% |
| aconst_null | 5524 | 0.71% |
| iadd | 5454 | 0.70% |
| pop | 5329 | 0.69% |
| astore_2 | 4715 | 0.61% |
| iinc | 4545 | 0.59% |
| ifnonnull | 4512 | 0.58% |
| isub | 3828 | 0.49% |
| astore_3 | 3633 | 0.47% |
| if_icmpge | 3600 | 0.46% |
| putstatic | 3357 | 0.43% |
| arraylength | 3354 | 0.43% |
| astore_1 | 3324 | 0.43% |
| if_icmpne | 2988 | 0.38% |
| iconst_2 | 2946 | 0.38% |
| ldc2_w | 2937 | 0.38% |
| iastore | 2928 | 0.38% |
| lload | 2807 | 0.36% |
| istore_3 | 2614 | 0.34% |
| istore_2 | 2535 | 0.33% |
| aaload | 2455 | 0.32% |
| monitorexit | 2414 | 0.31% |
| dload | 2393 | 0.31% |
| ldc_w | 2174 | 0.28% |
| lcmp | 2014 | 0.26% |
| iconst_m1 | 1895 | 0.24% |
| iand | 1817 | 0.23% |
| lload_1 | 1776 | 0.23% |
| if_icmpeq | 1745 | 0.22% |
| instanceof | 1723 | 0.22% |
| if_acmpne | 1699 | 0.22% |
| iaload | 1675 | 0.22% |
| ifge | 1604 | 0.21% |
| i2l | 1585 | 0.20% |
| anewarray | 1585 | 0.20% |
| if_icmple | 1533 | 0.20% |
| lstore | 1487 | 0.19% |
| iload_0 | 1470 | 0.19% |
| castore | 1428 | 0.18% |
| iflt | 1427 | 0.18% |
| lconst_0 | 1414 | 0.18% |
| newarray | 1382 | 0.18% |
| ifle | 1351 | 0.17% |
| istore_1 | 1339 | 0.17% |
| iconst_3 | 1336 | 0.17% |
| if_icmplt | 1078 | 0.14% |
| monitorenter | 1065 | 0.14% |
| dstore | 1032 | 0.13% |
| iconst_4 | 1007 | 0.13% |
| lreturn | 998 | 0.13% |
| lload_2 | 990 | 0.13% |
| if_icmpgt | 951 | 0.12% |
| ladd | 922 | 0.12% |
| if_acmpeq | 906 | 0.12% |
| ior | 783 | 0.10% |
| ishl | 778 | 0.10% |
| dup_x1 | 760 | 0.10% |
| astore_0 | 738 | 0.10% |
| imul | 710 | 0.09% |
| lload_3 | 691 | 0.09% |
| fload | 687 | 0.09% |
| iconst_5 | 642 | 0.08% |
| dmul | 635 | 0.08% |
| l2i | 622 | 0.08% |
| lload_0 | 618 | 0.08% |
| lsub | 610 | 0.08% |
| dadd | 599 | 0.08% |
| caload | 584 | 0.08% |
| lconst_1 | 570 | 0.07% |
| bastore | 567 | 0.07% |
| ifgt | 549 | 0.07% |
| dload_1 | 544 | 0.07% |
| land | 542 | 0.07% |
| daload | 536 | 0.07% |
| faload | 507 | 0.07% |
| dastore | 491 | 0.06% |
| dconst_0 | 483 | 0.06% |
| iushr | 483 | 0.06% |
| baload | 467 | 0.06% |
| dload_3 | 458 | 0.06% |
| fastore | 431 | 0.06% |
| dcmpl | 412 | 0.05% |
| dup2 | 409 | 0.05% |
| fstore | 393 | 0.05% |
| fmul | 380 | 0.05% |
| ishr | 371 | 0.05% |
| dreturn | 363 | 0.05% |
| invokedynamic | 353 | 0.05% |
| tableswitch | 344 | 0.04% |
| laload | 328 | 0.04% |
| i2f | 326 | 0.04% |
| lshl | 307 | 0.04% |
| idiv | 306 | 0.04% |
| ixor | 295 | 0.04% |
| f2d | 291 | 0.04% |
| i2b | 285 | 0.04% |
| fadd | 284 | 0.04% |
| lastore | 276 | 0.04% |
| dsub | 272 | 0.04% |
| lstore_3 | 270 | 0.03% |
| lmul | 254 | 0.03% |
| dcmpg | 249 | 0.03% |
| lushr | 248 | 0.03% |
| dload_2 | 240 | 0.03% |
| lstore_2 | 240 | 0.03% |
| d2f | 226 | 0.03% |
| ddiv | 220 | 0.03% |
| saload | 219 | 0.03% |
| dload_0 | 212 | 0.03% |
| lstore_1 | 210 | 0.03% |
| fload_1 | 207 | 0.03% |
| lor | 199 | 0.03% |
| fconst_0 | 198 | 0.03% |
| lookupswitch | 198 | 0.03% |
| ldiv | 193 | 0.02% |
| fload_2 | 189 | 0.02% |
| ineg | 189 | 0.02% |
| freturn | 181 | 0.02% |
| f2i | 178 | 0.02% |
| irem | 175 | 0.02% |
| i2c | 158 | 0.02% |
| fcmpl | 147 | 0.02% |
| dconst_1 | 142 | 0.02% |
| istore_0 | 138 | 0.02% |
| lrem | 138 | 0.02% |
| i2d | 127 | 0.02% |
| sastore | 125 | 0.02% |
| fdiv | 125 | 0.02% |
| lneg | 125 | 0.02% |
| fsub | 120 | 0.02% |
| fload_3 | 111 | 0.01% |
| fload_0 | 101 | 0.01% |
| fcmpg | 101 | 0.01% |
| pop2 | 98 | 0.01% |
| fconst_1 | 95 | 0.01% |
| dneg | 94 | 0.01% |
| i2s | 89 | 0.01% |
| d2i | 88 | 0.01% |
| lshr | 80 | 0.01% |
| lxor | 79 | 0.01% |
| dstore_3 | 73 | 0.01% |
| dstore_1 | 67 | 0.01% |
| dup2_x1 | 50 | 0.01% |
| lstore_0 | 49 | 0.01% |
| fstore_1 | 41 | 0.01% |
| dup_x2 | 40 | 0.01% |
| dstore_2 | 38 | 0.00% |
| l2d | 32 | 0.00% |
| fstore_3 | 28 | 0.00% |
| fstore_2 | 23 | 0.00% |
| fneg | 21 | 0.00% |
| dstore_0 | 20 | 0.00% |
| fconst_2 | 16 | 0.00% |
| multianewarray | 10 | 0.00% |
| l2f | 9 | 0.00% |
| d2l | 8 | 0.00% |
| fstore_0 | 5 | 0.00% |
| drem | 5 | 0.00% |
| f2l | 1 | 0.00% |
Full data: Instructions by Count
nextInstructionFreq - Find probability of next instruction (NB: Attempts to follow bytecode)
For each type of bytecode instruction, find the frequency of the next instruction encountered.
This is done by finding all valid instruction sequences of length 2 and calculating the frequency of the each next instruction.
./jarScan.sh --mode=nextInstructionFreq --packages=java.* rt.jar
Here are the 4 most frequent next instructions for each bytecode instruction found in the core java.* packages.
| Instruction | Next | Count | Percent |
|---|---|---|---|
| aaload | astore | 486 | 19.80% |
| aaload | invokevirtual | 356 | 14.50% |
| aaload | aastore | 151 | 6.15% |
| aaload | areturn | 126 | 5.13% |
| Instruction | Next | Count | Percent |
|---|---|---|---|
| aastore | dup | 4419 | 70.77% |
| aastore | invokespecial | 265 | 4.24% |
| aastore | iinc | 245 | 3.92% |
| aastore | invokestatic | 183 | 2.93% |
| Instruction | Next | Count | Percent |
|---|---|---|---|
| aconst_null | putfield | 1117 | 20.22% |
| aconst_null | areturn | 1071 | 19.39% |
| aconst_null | astore | 547 | 9.90% |
| aconst_null | invokespecial | 528 | 9.56% |
| Instruction | Next | Count | Percent |
|---|---|---|---|
| aload | invokevirtual | 4324 | 17.47% |
| aload | iload | 2132 | 8.62% |
| aload | getfield | 1894 | 7.65% |
| aload | aload | 1795 | 7.25% |
| Instruction | Next | Count | Percent |
|---|---|---|---|
| aload_0 | getfield | 34018 | 40.59% |
| aload_0 | aload_1 | 8489 | 10.13% |
| aload_0 | invokevirtual | 8026 | 9.58% |
| aload_0 | invokespecial | 5355 | 6.39% |
| Instruction | Next | Count | Percent |
|---|---|---|---|
| aload_1 | invokevirtual | 6209 | 19.39% |
| aload_1 | getfield | 2075 | 6.48% |
| aload_1 | invokespecial | 2048 | 6.40% |
| aload_1 | aload_2 | 1886 | 5.89% |
| Instruction | Next | Count | Percent |
|---|---|---|---|
| aload_2 | invokevirtual | 2939 | 18.05% |
| aload_2 | getfield | 1311 | 8.05% |
| aload_2 | invokespecial | 1019 | 6.26% |
| aload_2 | invokeinterface | 797 | 4.89% |
| Instruction | Next | Count | Percent |
|---|---|---|---|
| aload_3 | invokevirtual | 1847 | 18.72% |
| aload_3 | iload | 746 | 7.56% |
| aload_3 | ifnull | 611 | 6.19% |
| aload_3 | aload | 589 | 5.97% |
| Instruction | Next | Count | Percent |
|---|---|---|---|
| anewarray | dup | 955 | 60.25% |
| anewarray | putfield | 126 | 7.95% |
| anewarray | astore | 124 | 7.82% |
| anewarray | putstatic | 71 | 4.48% |
| Instruction | Next | Count | Percent |
|---|---|---|---|
| arraylength | if_icmpge | 710 | 21.17% |
| arraylength | iconst_1 | 311 | 9.27% |
| arraylength | istore | 276 | 8.23% |
| arraylength | invokestatic | 241 | 7.19% |
| Instruction | Next | Count | Percent |
|---|---|---|---|
| astore | aload | 4393 | 39.61% |
| astore | aload_0 | 1235 | 11.14% |
| astore | goto | 909 | 8.20% |
| astore | aload_3 | 587 | 5.29% |
| Instruction | Next | Count | Percent |
|---|---|---|---|
| astore_0 | getstatic | 286 | 38.75% |
| astore_0 | aload_0 | 182 | 24.66% |
| astore_0 | new | 77 | 10.43% |
| astore_0 | return | 46 | 6.23% |
| Instruction | Next | Count | Percent |
|---|---|---|---|
| astore_1 | aload_1 | 1254 | 37.73% |
| astore_1 | aload_0 | 616 | 18.53% |
| astore_1 | monitorenter | 337 | 10.14% |
| astore_1 | goto | 283 | 8.51% |
| Instruction | Next | Count | Percent |
|---|---|---|---|
| astore_2 | aload_2 | 1519 | 32.22% |
| astore_2 | aload_0 | 867 | 18.39% |
| astore_2 | aload_1 | 592 | 12.56% |
| astore_2 | goto | 372 | 7.89% |
| Instruction | Next | Count | Percent |
|---|---|---|---|
| astore_3 | aload_3 | 1088 | 29.95% |
| astore_3 | aload_0 | 545 | 15.00% |
| astore_3 | aload_2 | 475 | 13.07% |
| astore_3 | aload_1 | 287 | 7.90% |
| Instruction | Next | Count | Percent |
|---|---|---|---|
| baload | sipush | 165 | 35.33% |
| baload | bipush | 43 | 9.21% |
| baload | invokestatic | 30 | 6.42% |
| baload | ifne | 26 | 5.57% |
| Instruction | Next | Count | Percent |
|---|---|---|---|
| bastore | dup | 299 | 52.73% |
| bastore | aload_0 | 68 | 11.99% |
| bastore | iinc | 65 | 11.46% |
| bastore | goto | 27 | 4.76% |
| Instruction | Next | Count | Percent |
|---|---|---|---|
| bipush | bipush | 1020 | 8.95% |
| bipush | invokevirtual | 913 | 8.01% |
| bipush | castore | 834 | 7.31% |
| bipush | if_icmpne | 764 | 6.70% |
| Instruction | Next | Count | Percent |
|---|---|---|---|
| caload | bipush | 191 | 32.71% |
| caload | castore | 74 | 12.67% |
| caload | istore | 73 | 12.50% |
| caload | invokevirtual | 35 | 5.99% |
| Instruction | Next | Count | Percent |
|---|---|---|---|
| castore | dup | 931 | 65.20% |
| castore | aastore | 206 | 14.43% |
| castore | aload_0 | 61 | 4.27% |
| castore | goto | 48 | 3.36% |
| Instruction | Next | Count | Percent |
|---|---|---|---|
| checkcast | astore | 1009 | 16.96% |
| checkcast | invokevirtual | 944 | 15.87% |
| checkcast | areturn | 813 | 13.67% |
| checkcast | astore_2 | 554 | 9.31% |
| Instruction | Next | Count | Percent |
|---|---|---|---|
| d2f | fastore | 105 | 46.46% |
| d2f | putfield | 64 | 28.32% |
| d2f | freturn | 14 | 6.19% |
| d2f | aload_0 | 8 | 3.54% |
| Instruction | Next | Count | Percent |
|---|---|---|---|
| d2i | istore | 19 | 21.59% |
| d2i | putfield | 12 | 13.64% |
| d2i | ireturn | 10 | 11.36% |
| d2i | invokespecial | 6 | 6.82% |
| Instruction | Next | Count | Percent |
|---|---|---|---|
| d2l | lreturn | 4 | 50.00% |
| d2l | ladd | 2 | 25.00% |
| d2l | lstore | 2 | 25.00% |
| Instruction | Next | Count | Percent |
|---|---|---|---|
| dadd | dstore | 106 | 17.70% |
| dadd | dastore | 68 | 11.35% |
| dadd | putfield | 56 | 9.35% |
| dadd | invokestatic | 53 | 8.85% |
| Instruction | Next | Count | Percent |
|---|---|---|---|
| daload | dstore | 91 | 16.98% |
| daload | aload_0 | 69 | 12.87% |
| daload | dastore | 49 | 9.14% |
| daload | dload | 39 | 7.28% |
| Instruction | Next | Count | Percent |
|---|---|---|---|
| dastore | dup | 128 | 26.07% |
| dastore | aload_0 | 90 | 18.33% |
| dastore | aload_1 | 54 | 11.00% |
| dastore | goto | 49 | 9.98% |
| Instruction | Next | Count | Percent |
|---|---|---|---|
| dcmpg | ifge | 117 | 46.99% |
| dcmpg | ifgt | 71 | 28.51% |
| dcmpg | iflt | 33 | 13.25% |
| dcmpg | ifle | 28 | 11.24% |
| Instruction | Next | Count | Percent |
|---|---|---|---|
| dcmpl | ifne | 181 | 43.93% |
| dcmpl | ifeq | 85 | 20.63% |
| dcmpl | ifle | 75 | 18.20% |
| dcmpl | iflt | 53 | 12.86% |
| Instruction | Next | Count | Percent |
|---|---|---|---|
| dconst_0 | dcmpl | 165 | 34.16% |
| dconst_0 | dcmpg | 108 | 22.36% |
| dconst_0 | putfield | 53 | 10.97% |
| dconst_0 | dastore | 52 | 10.77% |
| Instruction | Next | Count | Percent |
|---|---|---|---|
| dconst_1 | dcmpl | 34 | 23.94% |
| dconst_1 | dastore | 27 | 19.01% |
| dconst_1 | putfield | 12 | 8.45% |
| dconst_1 | aload_0 | 11 | 7.75% |
| Instruction | Next | Count | Percent |
|---|---|---|---|
| ddiv | dstore | 66 | 30.00% |
| ddiv | putfield | 28 | 12.73% |
| ddiv | invokestatic | 18 | 8.18% |
| ddiv | dastore | 17 | 7.73% |
| Instruction | Next | Count | Percent |
|---|---|---|---|
| dload | dload | 654 | 27.33% |
| dload | dmul | 269 | 11.24% |
| dload | dadd | 198 | 8.27% |
| dload | dconst_0 | 114 | 4.76% |
| Instruction | Next | Count | Percent |
|---|---|---|---|
| dload_0 | invokestatic | 64 | 30.19% |
| dload_0 | dload_2 | 44 | 20.75% |
| dload_0 | ldc2_w | 25 | 11.79% |
| dload_0 | dconst_0 | 17 | 8.02% |
| Instruction | Next | Count | Percent |
|---|---|---|---|
| dload_1 | dload_3 | 112 | 20.59% |
| dload_1 | dload | 75 | 13.79% |
| dload_1 | invokestatic | 56 | 10.29% |
| dload_1 | putfield | 34 | 6.25% |
| Instruction | Next | Count | Percent |
|---|---|---|---|
| dload_2 | invokestatic | 51 | 21.25% |
| dload_2 | dload | 45 | 18.75% |
| dload_2 | dmul | 26 | 10.83% |
| dload_2 | aload_0 | 11 | 4.58% |
| Instruction | Next | Count | Percent |
|---|---|---|---|
| dload_3 | dload | 154 | 33.62% |
| dload_3 | aload_0 | 44 | 9.61% |
| dload_3 | putfield | 26 | 5.68% |
| dload_3 | invokevirtual | 24 | 5.24% |
| Instruction | Next | Count | Percent |
|---|---|---|---|
| dmul | dadd | 187 | 29.45% |
| dmul | dload | 151 | 23.78% |
| dmul | putfield | 54 | 8.50% |
| dmul | dsub | 43 | 6.77% |
| Instruction | Next | Count | Percent |
|---|---|---|---|
| dneg | dload | 18 | 19.15% |
| dneg | putfield | 17 | 18.09% |
| dneg | invokestatic | 11 | 11.70% |
| dneg | dstore | 10 | 10.64% |
| Instruction | Next | Count | Percent |
|---|---|---|---|
| drem | putfield | 2 | 40.00% |
| drem | dstore | 1 | 20.00% |
| drem | dstore_0 | 1 | 20.00% |
| drem | ldc2_w | 1 | 20.00% |
| Instruction | Next | Count | Percent |
|---|---|---|---|
| dstore | dload | 314 | 30.43% |
| dstore | aload_0 | 259 | 25.10% |
| dstore | goto | 63 | 6.10% |
| dstore | iinc | 55 | 5.33% |
| Instruction | Next | Count | Percent |
|---|---|---|---|
| dstore_0 | dload_0 | 11 | 55.00% |
| dstore_0 | goto | 3 | 15.00% |
| dstore_0 | dload_2 | 2 | 10.00% |
| dstore_0 | iload_2 | 2 | 10.00% |
| Instruction | Next | Count | Percent |
|---|---|---|---|
| dstore_1 | aload_0 | 22 | 32.84% |
| dstore_1 | goto | 14 | 20.90% |
| dstore_1 | dload_1 | 13 | 19.40% |
| dstore_1 | dload_3 | 5 | 7.46% |
| Instruction | Next | Count | Percent |
|---|---|---|---|
| dstore_2 | aload_0 | 26 | 68.42% |
| dstore_2 | dload_2 | 6 | 15.79% |
| dstore_2 | aload_1 | 2 | 5.26% |
| dstore_2 | dload_0 | 2 | 5.26% |
| Instruction | Next | Count | Percent |
|---|---|---|---|
| dstore_3 | aload_0 | 28 | 38.36% |
| dstore_3 | dload_1 | 9 | 12.33% |
| dstore_3 | dload | 8 | 10.96% |
| dstore_3 | dload_3 | 7 | 9.59% |
| Instruction | Next | Count | Percent |
|---|---|---|---|
| dsub | dstore | 95 | 34.93% |
| dsub | dload | 42 | 15.44% |
| dsub | dmul | 19 | 6.99% |
| dsub | invokestatic | 16 | 5.88% |
| Instruction | Next | Count | Percent |
|---|---|---|---|
| dup | invokespecial | 6338 | 21.41% |
| dup | bipush | 3394 | 11.46% |
| dup | ldc | 3304 | 11.16% |
| dup | sipush | 2727 | 9.21% |
| Instruction | Next | Count | Percent |
|---|---|---|---|
| dup2 | lstore | 113 | 27.63% |
| dup2 | dstore | 74 | 18.09% |
| dup2 | laload | 45 | 11.00% |
| dup2 | iaload | 41 | 10.02% |
| Instruction | Next | Count | Percent |
|---|---|---|---|
| dup2_x1 | putfield | 50 | 100.00% |
| Instruction | Next | Count | Percent |
|---|---|---|---|
| dup_x1 | putfield | 558 | 73.42% |
| dup_x1 | iconst_1 | 202 | 26.58% |
| Instruction | Next | Count | Percent |
|---|---|---|---|
| dup_x2 | aastore | 15 | 37.50% |
| dup_x2 | iastore | 12 | 30.00% |
| dup_x2 | fastore | 11 | 27.50% |
| dup_x2 | castore | 2 | 5.00% |
| Instruction | Next | Count | Percent |
|---|---|---|---|
| f2d | dreturn | 43 | 14.78% |
| f2d | dstore | 34 | 11.68% |
| f2d | dmul | 23 | 7.90% |
| f2d | dup2 | 22 | 7.56% |
| Instruction | Next | Count | Percent |
|---|---|---|---|
| f2i | istore | 35 | 19.66% |
| f2i | i2s | 27 | 15.17% |
| f2i | iastore | 26 | 14.61% |
| f2i | ireturn | 17 | 9.55% |
| Instruction | Next | Count | Percent |
|---|---|---|---|
| f2l | lreturn | 1 | 100.00% |
| Instruction | Next | Count | Percent |
|---|---|---|---|
| fadd | f2i | 124 | 43.66% |
| fadd | fstore | 68 | 23.94% |
| fadd | ldc | 16 | 5.63% |
| fadd | fastore | 12 | 4.23% |
| Instruction | Next | Count | Percent |
|---|---|---|---|
| faload | f2d | 95 | 18.74% |
| faload | fastore | 72 | 14.20% |
| faload | fstore | 62 | 12.23% |
| faload | fload | 44 | 8.68% |
| Instruction | Next | Count | Percent |
|---|---|---|---|
| fastore | aload_0 | 114 | 26.45% |
| fastore | iinc | 83 | 19.26% |
| fastore | goto | 46 | 10.67% |
| fastore | aload_1 | 35 | 8.12% |
| Instruction | Next | Count | Percent |
|---|---|---|---|
| fcmpg | ifge | 64 | 63.37% |
| fcmpg | ifgt | 27 | 26.73% |
| fcmpg | ifle | 7 | 6.93% |
| fcmpg | iflt | 3 | 2.97% |
| Instruction | Next | Count | Percent |
|---|---|---|---|
| fcmpl | ifeq | 56 | 38.10% |
| fcmpl | ifne | 44 | 29.93% |
| fcmpl | ifle | 34 | 23.13% |
| fcmpl | iflt | 10 | 6.80% |
| Instruction | Next | Count | Percent |
|---|---|---|---|
| fconst_0 | fcmpl | 60 | 30.30% |
| fconst_0 | fcmpg | 40 | 20.20% |
| fconst_0 | fstore | 30 | 15.15% |
| fconst_0 | fastore | 16 | 8.08% |
| Instruction | Next | Count | Percent |
|---|---|---|---|
| fconst_1 | fcmpl | 17 | 17.89% |
| fconst_1 | fload | 10 | 10.53% |
| fconst_1 | fastore | 9 | 9.47% |
| fconst_1 | fcmpg | 9 | 9.47% |
| Instruction | Next | Count | Percent |
|---|---|---|---|
| fconst_2 | fdiv | 7 | 43.75% |
| fconst_2 | aload_0 | 3 | 18.75% |
| fconst_2 | fcmpl | 2 | 12.50% |
| fconst_2 | fload | 1 | 6.25% |
| Instruction | Next | Count | Percent |
|---|---|---|---|
| fdiv | fstore | 42 | 33.60% |
| fdiv | fastore | 34 | 27.20% |
| fdiv | ldc | 9 | 7.20% |
| fdiv | fload | 7 | 5.60% |
| Instruction | Next | Count | Percent |
|---|---|---|---|
| fload | fmul | 132 | 19.21% |
| fload | fload | 105 | 15.28% |
| fload | aload | 40 | 5.82% |
| fload | fastore | 38 | 5.53% |
| Instruction | Next | Count | Percent |
|---|---|---|---|
| fload_0 | invokestatic | 29 | 28.71% |
| fload_0 | fload_1 | 15 | 14.85% |
| fload_0 | ldc | 14 | 13.86% |
| fload_0 | f2d | 11 | 10.89% |
| Instruction | Next | Count | Percent |
|---|---|---|---|
| fload_1 | fload_2 | 25 | 12.08% |
| fload_1 | invokestatic | 23 | 11.11% |
| fload_1 | putfield | 17 | 8.21% |
| fload_1 | fconst_0 | 14 | 6.76% |
| Instruction | Next | Count | Percent |
|---|---|---|---|
| fload_2 | fload_3 | 20 | 10.58% |
| fload_2 | invokestatic | 20 | 10.58% |
| fload_2 | putfield | 20 | 10.58% |
| fload_2 | f2d | 15 | 7.94% |
| Instruction | Next | Count | Percent |
|---|---|---|---|
| fload_3 | putfield | 15 | 13.51% |
| fload_3 | f2d | 14 | 12.61% |
| fload_3 | fload | 12 | 10.81% |
| fload_3 | fastore | 6 | 5.41% |
| Instruction | Next | Count | Percent |
|---|---|---|---|
| fmul | ldc | 128 | 33.68% |
| fmul | fstore | 57 | 15.00% |
| fmul | fadd | 55 | 14.47% |
| fmul | fastore | 37 | 9.74% |
| Instruction | Next | Count | Percent |
|---|---|---|---|
| fneg | aload_0 | 4 | 19.05% |
| fneg | f2d | 4 | 19.05% |
| fneg | aload | 3 | 14.29% |
| fneg | fstore | 3 | 14.29% |
| Instruction | Next | Count | Percent |
|---|---|---|---|
| fstore | fload | 117 | 29.77% |
| fstore | aload_0 | 48 | 12.21% |
| fstore | iconst_0 | 41 | 10.43% |
| fstore | aload | 37 | 9.41% |
| Instruction | Next | Count | Percent |
|---|---|---|---|
| fstore_0 | fload_0 | 5 | 100.00% |
| Instruction | Next | Count | Percent |
|---|---|---|---|
| fstore_1 | aload_0 | 8 | 19.51% |
| fstore_1 | goto | 8 | 19.51% |
| fstore_1 | fload_1 | 7 | 17.07% |
| fstore_1 | getstatic | 4 | 9.76% |
| Instruction | Next | Count | Percent |
|---|---|---|---|
| fstore_2 | aload_0 | 9 | 39.13% |
| fstore_2 | fload_2 | 4 | 17.39% |
| fstore_2 | fload | 2 | 8.70% |
| fstore_2 | fload_3 | 2 | 8.70% |
| Instruction | Next | Count | Percent |
|---|---|---|---|
| fstore_3 | aload_0 | 6 | 21.43% |
| fstore_3 | fload_3 | 4 | 14.29% |
| fstore_3 | goto | 4 | 14.29% |
| fstore_3 | fconst_0 | 2 | 7.14% |
| Instruction | Next | Count | Percent |
|---|---|---|---|
| fsub | fstore | 28 | 23.33% |
| fsub | fload | 15 | 12.50% |
| fsub | fmul | 12 | 10.00% |
| fsub | aload_0 | 7 | 5.83% |
| Instruction | Next | Count | Percent |
|---|---|---|---|
| getfield | invokevirtual | 4591 | 10.90% |
| getfield | aload_0 | 3206 | 7.61% |
| getfield | aload_1 | 2225 | 5.28% |
| getfield | invokestatic | 1499 | 3.56% |
| Instruction | Next | Count | Percent |
|---|---|---|---|
| getstatic | invokevirtual | 1551 | 13.30% |
| getstatic | aastore | 1355 | 11.61% |
| getstatic | ifne | 1037 | 8.89% |
| getstatic | aload_0 | 777 | 6.66% |
| Instruction | Next | Count | Percent |
|---|---|---|---|
| goto | iload | 2386 | 13.05% |
| goto | aload_0 | 2086 | 11.41% |
| goto | return | 1691 | 9.25% |
| goto | ireturn | 1530 | 8.37% |
| Instruction | Next | Count | Percent |
|---|---|---|---|
| i2b | bastore | 171 | 60.00% |
| i2b | ireturn | 33 | 11.58% |
| i2b | istore | 20 | 7.02% |
| i2b | putfield | 17 | 5.96% |
| Instruction | Next | Count | Percent |
|---|---|---|---|
| i2c | invokevirtual | 57 | 36.08% |
| i2c | castore | 36 | 22.78% |
| i2c | ireturn | 15 | 9.49% |
| i2c | istore_2 | 15 | 9.49% |
| Instruction | Next | Count | Percent |
|---|---|---|---|
| i2d | ldc2_w | 15 | 11.81% |
| i2d | dreturn | 14 | 11.02% |
| i2d | dmul | 13 | 10.24% |
| i2d | aload_0 | 10 | 7.87% |
| Instruction | Next | Count | Percent |
|---|---|---|---|
| i2f | fmul | 74 | 22.70% |
| i2f | fload | 72 | 22.09% |
| i2f | ldc | 57 | 17.48% |
| i2f | aload_0 | 25 | 7.67% |
| Instruction | Next | Count | Percent |
|---|---|---|---|
| i2l | ladd | 249 | 15.71% |
| i2l | ldc2_w | 218 | 13.75% |
| i2l | lsub | 158 | 9.97% |
| i2l | lreturn | 93 | 5.87% |
| Instruction | Next | Count | Percent |
|---|---|---|---|
| i2s | sastore | 49 | 55.06% |
| i2s | ireturn | 18 | 20.22% |
| i2s | putfield | 6 | 6.74% |
| i2s | i2l | 2 | 2.25% |
| Instruction | Next | Count | Percent |
|---|---|---|---|
| iadd | istore | 898 | 16.46% |
| iadd | putfield | 679 | 12.45% |
| iadd | invokevirtual | 393 | 7.21% |
| iadd | iload | 342 | 6.27% |
| Instruction | Next | Count | Percent |
|---|---|---|---|
| iaload | istore | 221 | 13.19% |
| iaload | iload | 97 | 5.79% |
| iaload | iadd | 96 | 5.73% |
| iaload | i2l | 90 | 5.37% |
| Instruction | Next | Count | Percent |
|---|---|---|---|
| iand | ifeq | 415 | 22.84% |
| iand | istore | 197 | 10.84% |
| iand | ifne | 125 | 6.88% |
| iand | bipush | 91 | 5.01% |
| Instruction | Next | Count | Percent |
|---|---|---|---|
| iastore | dup | 1783 | 60.89% |
| iastore | goto | 389 | 13.29% |
| iastore | iinc | 197 | 6.73% |
| iastore | aload_0 | 125 | 4.27% |
| Instruction | Next | Count | Percent |
|---|---|---|---|
| iconst_0 | ireturn | 3123 | 20.23% |
| iconst_0 | istore | 2461 | 15.94% |
| iconst_0 | putfield | 1232 | 7.98% |
| iconst_0 | invokevirtual | 659 | 4.27% |
| Instruction | Next | Count | Percent |
|---|---|---|---|
| iconst_1 | goto | 2022 | 14.87% |
| iconst_1 | iadd | 1661 | 12.22% |
| iconst_1 | isub | 1561 | 11.48% |
| iconst_1 | ireturn | 1228 | 9.03% |
| Instruction | Next | Count | Percent |
|---|---|---|---|
| iconst_2 | anewarray | 450 | 15.27% |
| iconst_2 | iadd | 192 | 6.52% |
| iconst_2 | newarray | 189 | 6.42% |
| iconst_2 | invokevirtual | 125 | 4.24% |
| Instruction | Next | Count | Percent |
|---|---|---|---|
| iconst_3 | anewarray | 71 | 5.31% |
| iconst_3 | invokevirtual | 71 | 5.31% |
| iconst_3 | getstatic | 68 | 5.09% |
| iconst_3 | invokespecial | 61 | 4.57% |
| Instruction | Next | Count | Percent |
|---|---|---|---|
| iconst_4 | invokevirtual | 71 | 7.05% |
| iconst_4 | anewarray | 64 | 6.36% |
| iconst_4 | iadd | 59 | 5.86% |
| iconst_4 | iand | 58 | 5.76% |
| Instruction | Next | Count | Percent |
|---|---|---|---|
| iconst_5 | invokevirtual | 39 | 6.07% |
| iconst_5 | getstatic | 37 | 5.76% |
| iconst_5 | invokespecial | 37 | 5.76% |
| iconst_5 | iastore | 35 | 5.45% |
| Instruction | Next | Count | Percent |
|---|---|---|---|
| iconst_m1 | if_icmpne | 272 | 14.35% |
| iconst_m1 | ireturn | 241 | 12.72% |
| iconst_m1 | if_icmpeq | 238 | 12.56% |
| iconst_m1 | putfield | 226 | 11.93% |
| Instruction | Next | Count | Percent |
|---|---|---|---|
| idiv | istore | 54 | 17.65% |
| idiv | iadd | 50 | 16.34% |
| idiv | bipush | 24 | 7.84% |
| idiv | dup | 22 | 7.19% |
| Instruction | Next | Count | Percent |
|---|---|---|---|
| if_acmpeq | aload_0 | 169 | 18.65% |
| if_acmpeq | new | 147 | 16.23% |
| if_acmpeq | aload_1 | 138 | 15.23% |
| if_acmpeq | aload | 135 | 14.90% |
| Instruction | Next | Count | Percent |
|---|---|---|---|
| if_acmpne | aload_0 | 475 | 27.96% |
| if_acmpne | iconst_1 | 317 | 18.66% |
| if_acmpne | aload_1 | 134 | 7.89% |
| if_acmpne | aload | 129 | 7.59% |
| Instruction | Next | Count | Percent |
|---|---|---|---|
| if_icmpeq | new | 454 | 26.02% |
| if_icmpeq | aload_0 | 294 | 16.85% |
| if_icmpeq | iload | 221 | 12.66% |
| if_icmpeq | iconst_0 | 148 | 8.48% |
| Instruction | Next | Count | Percent |
|---|---|---|---|
| if_icmpge | aload_0 | 1063 | 29.53% |
| if_icmpge | aload | 541 | 15.03% |
| if_icmpge | aload_1 | 463 | 12.86% |
| if_icmpge | aload_2 | 293 | 8.14% |
| Instruction | Next | Count | Percent |
|---|---|---|---|
| if_icmpgt | iload | 189 | 19.87% |
| if_icmpgt | aload_0 | 184 | 19.35% |
| if_icmpgt | iload_2 | 165 | 17.35% |
| if_icmpgt | iload_3 | 62 | 6.52% |
| Instruction | Next | Count | Percent |
|---|---|---|---|
| if_icmple | new | 666 | 43.44% |
| if_icmple | aload_0 | 233 | 15.20% |
| if_icmple | iload | 127 | 8.28% |
| if_icmple | iconst_1 | 66 | 4.31% |
| Instruction | Next | Count | Percent |
|---|---|---|---|
| if_icmplt | aload_0 | 233 | 21.61% |
| if_icmplt | new | 157 | 14.56% |
| if_icmplt | iload | 137 | 12.71% |
| if_icmplt | iload_1 | 79 | 7.33% |
| Instruction | Next | Count | Percent |
|---|---|---|---|
| if_icmpne | aload_0 | 824 | 27.58% |
| if_icmpne | iconst_1 | 330 | 11.04% |
| if_icmpne | iload | 260 | 8.70% |
| if_icmpne | aload | 258 | 8.63% |
| Instruction | Next | Count | Percent |
|---|---|---|---|
| ifeq | aload_0 | 2750 | 27.84% |
| ifeq | aload_1 | 997 | 10.09% |
| ifeq | aload | 973 | 9.85% |
| ifeq | new | 819 | 8.29% |
| Instruction | Next | Count | Percent |
|---|---|---|---|
| ifge | new | 451 | 28.12% |
| ifge | aload_0 | 263 | 16.40% |
| ifge | iload | 109 | 6.80% |
| ifge | iconst_0 | 77 | 4.80% |
| Instruction | Next | Count | Percent |
|---|---|---|---|
| ifgt | new | 105 | 19.13% |
| ifgt | aload_0 | 64 | 11.66% |
| ifgt | iconst_0 | 62 | 11.29% |
| ifgt | iload | 50 | 9.11% |
| Instruction | Next | Count | Percent |
|---|---|---|---|
| ifle | aload_0 | 370 | 27.39% |
| ifle | iload | 149 | 11.03% |
| ifle | aload | 92 | 6.81% |
| ifle | iconst_1 | 91 | 6.74% |
| Instruction | Next | Count | Percent |
|---|---|---|---|
| iflt | aload_0 | 236 | 16.54% |
| iflt | iload | 176 | 12.33% |
| iflt | iload_2 | 173 | 12.12% |
| iflt | iload_1 | 168 | 11.77% |
| Instruction | Next | Count | Percent |
|---|---|---|---|
| ifne | aload_0 | 1616 | 24.34% |
| ifne | new | 883 | 13.30% |
| ifne | iconst_1 | 551 | 8.30% |
| ifne | iconst_0 | 487 | 7.34% |
| Instruction | Next | Count | Percent |
|---|---|---|---|
| ifnonnull | new | 1315 | 29.14% |
| ifnonnull | aload_0 | 1050 | 23.27% |
| ifnonnull | aconst_null | 287 | 6.36% |
| ifnonnull | iconst_0 | 277 | 6.14% |
| Instruction | Next | Count | Percent |
|---|---|---|---|
| ifnull | aload_0 | 1534 | 24.83% |
| ifnull | aload | 1188 | 19.23% |
| ifnull | aload_1 | 1053 | 17.05% |
| ifnull | aload_2 | 825 | 13.36% |
| Instruction | Next | Count | Percent |
|---|---|---|---|
| iinc | goto | 2629 | 57.84% |
| iinc | iload | 528 | 11.62% |
| iinc | iinc | 203 | 4.47% |
| iinc | aload | 134 | 2.95% |
| Instruction | Next | Count | Percent |
|---|---|---|---|
| iload | iload | 3772 | 14.69% |
| iload | iconst_1 | 1230 | 4.79% |
| iload | iadd | 1129 | 4.40% |
| iload | invokevirtual | 1079 | 4.20% |
| Instruction | Next | Count | Percent |
|---|---|---|---|
| iload_0 | bipush | 240 | 16.33% |
| iload_0 | invokestatic | 172 | 11.70% |
| iload_0 | iload_1 | 117 | 7.96% |
| iload_0 | sipush | 90 | 6.12% |
| Instruction | Next | Count | Percent |
|---|---|---|---|
| iload_1 | iload_2 | 1102 | 11.61% |
| iload_1 | invokevirtual | 908 | 9.57% |
| iload_1 | aload_0 | 633 | 6.67% |
| iload_1 | invokestatic | 487 | 5.13% |
| Instruction | Next | Count | Percent |
|---|---|---|---|
| iload_2 | iload_3 | 1005 | 10.27% |
| iload_2 | aload_0 | 655 | 6.69% |
| iload_2 | invokevirtual | 585 | 5.98% |
| iload_2 | invokespecial | 479 | 4.89% |
| Instruction | Next | Count | Percent |
|---|---|---|---|
| iload_3 | iload | 877 | 10.97% |
| iload_3 | invokevirtual | 536 | 6.70% |
| iload_3 | iadd | 373 | 4.66% |
| iload_3 | aload_0 | 345 | 4.31% |
| Instruction | Next | Count | Percent |
|---|---|---|---|
| imul | iadd | 115 | 16.20% |
| imul | aload_0 | 79 | 11.13% |
| imul | iload | 61 | 8.59% |
| imul | iload_1 | 57 | 8.03% |
| Instruction | Next | Count | Percent |
|---|---|---|---|
| ineg | ireturn | 22 | 11.64% |
| ineg | istore | 21 | 11.11% |
| ineg | invokevirtual | 20 | 10.58% |
| ineg | invokestatic | 18 | 9.52% |
| Instruction | Next | Count | Percent |
|---|---|---|---|
| instanceof | ifeq | 1324 | 76.84% |
| instanceof | ifne | 383 | 22.23% |
| instanceof | ireturn | 13 | 0.75% |
| instanceof | invokespecial | 1 | 0.06% |
| Instruction | Next | Count | Percent |
|---|---|---|---|
| invokedynamic | areturn | 81 | 22.95% |
| invokedynamic | invokedynamic | 57 | 16.15% |
| invokedynamic | invokeinterface | 45 | 12.75% |
| invokedynamic | invokevirtual | 45 | 12.75% |
| Instruction | Next | Count | Percent |
|---|---|---|---|
| invokeinterface | checkcast | 1018 | 12.60% |
| invokeinterface | ifeq | 794 | 9.83% |
| invokeinterface | pop | 714 | 8.84% |
| invokeinterface | areturn | 504 | 6.24% |
| Instruction | Next | Count | Percent |
|---|---|---|---|
| invokespecial | athrow | 6429 | 22.70% |
| invokespecial | return | 3369 | 11.90% |
| invokespecial | aload_0 | 3128 | 11.05% |
| invokespecial | areturn | 2571 | 9.08% |
| Instruction | Next | Count | Percent |
|---|---|---|---|
| invokestatic | areturn | 1959 | 11.34% |
| invokestatic | invokevirtual | 1017 | 5.89% |
| invokestatic | aload_0 | 861 | 4.98% |
| invokestatic | pop | 854 | 4.94% |
| Instruction | Next | Count | Percent |
|---|---|---|---|
| invokevirtual | invokevirtual | 5210 | 10.06% |
| invokevirtual | aload_0 | 4345 | 8.39% |
| invokevirtual | pop | 3408 | 6.58% |
| invokevirtual | areturn | 3266 | 6.31% |
| Instruction | Next | Count | Percent |
|---|---|---|---|
| ior | putfield | 107 | 13.67% |
| ior | istore | 94 | 12.01% |
| ior | istore_1 | 71 | 9.07% |
| ior | ireturn | 45 | 5.75% |
| Instruction | Next | Count | Percent |
|---|---|---|---|
| irem | istore | 55 | 31.43% |
| irem | ifne | 25 | 14.29% |
| irem | bipush | 11 | 6.29% |
| irem | iadd | 10 | 5.71% |
| Instruction | Next | Count | Percent |
|---|---|---|---|
| ishl | iconst_1 | 111 | 14.27% |
| ishl | ior | 111 | 14.27% |
| ishl | aload_0 | 74 | 9.51% |
| ishl | istore | 61 | 7.84% |
| Instruction | Next | Count | Percent |
|---|---|---|---|
| ishr | sipush | 80 | 21.56% |
| ishr | istore | 43 | 11.59% |
| ishr | bipush | 37 | 9.97% |
| ishr | iadd | 35 | 9.43% |
| Instruction | Next | Count | Percent |
|---|---|---|---|
| istore | iload | 4283 | 39.37% |
| istore | aload_0 | 1276 | 11.73% |
| istore | goto | 880 | 8.09% |
| istore | aload | 676 | 6.21% |
| Instruction | Next | Count | Percent |
|---|---|---|---|
| istore_0 | iload_0 | 83 | 60.14% |
| istore_0 | goto | 14 | 10.14% |
| istore_0 | getstatic | 8 | 5.80% |
| istore_0 | iinc | 7 | 5.07% |
| Instruction | Next | Count | Percent |
|---|---|---|---|
| istore_1 | iload_1 | 456 | 34.06% |
| istore_1 | aload_0 | 426 | 31.81% |
| istore_1 | goto | 154 | 11.50% |
| istore_1 | iinc | 63 | 4.71% |
| Instruction | Next | Count | Percent |
|---|---|---|---|
| istore_2 | iload_2 | 809 | 31.91% |
| istore_2 | aload_0 | 478 | 18.86% |
| istore_2 | goto | 443 | 17.48% |
| istore_2 | aload_1 | 187 | 7.38% |
| Instruction | Next | Count | Percent |
|---|---|---|---|
| istore_3 | iload_3 | 865 | 33.09% |
| istore_3 | aload_0 | 402 | 15.38% |
| istore_3 | goto | 398 | 15.23% |
| istore_3 | iconst_0 | 174 | 6.66% |
| Instruction | Next | Count | Percent |
|---|---|---|---|
| isub | istore | 739 | 19.31% |
| isub | putfield | 201 | 5.25% |
| isub | invokevirtual | 193 | 5.04% |
| isub | iload | 185 | 4.83% |
| Instruction | Next | Count | Percent |
|---|---|---|---|
| iushr | istore | 113 | 23.40% |
| iushr | dup | 61 | 12.63% |
| iushr | dup_x1 | 45 | 9.32% |
| iushr | sipush | 45 | 9.32% |
| Instruction | Next | Count | Percent |
|---|---|---|---|
| ixor | ireturn | 98 | 33.22% |
| ixor | istore_1 | 36 | 12.20% |
| ixor | aload_0 | 35 | 11.86% |
| ixor | iand | 21 | 7.12% |
| Instruction | Next | Count | Percent |
|---|---|---|---|
| l2d | ddiv | 7 | 21.88% |
| l2d | ldc2_w | 7 | 21.88% |
| l2d | dreturn | 6 | 18.75% |
| l2d | aload_0 | 5 | 15.63% |
| Instruction | Next | Count | Percent |
|---|---|---|---|
| l2f | freturn | 6 | 66.67% |
| l2f | getstatic | 2 | 22.22% |
| l2f | fload_2 | 1 | 11.11% |
| Instruction | Next | Count | Percent |
|---|---|---|---|
| l2i | istore | 125 | 20.10% |
| l2i | iastore | 65 | 10.45% |
| l2i | ireturn | 61 | 9.81% |
| l2i | invokevirtual | 39 | 6.27% |
| Instruction | Next | Count | Percent |
|---|---|---|---|
| ladd | lstore | 257 | 27.87% |
| ladd | putfield | 67 | 7.27% |
| ladd | invokestatic | 57 | 6.18% |
| ladd | lreturn | 48 | 5.21% |
| Instruction | Next | Count | Percent |
|---|---|---|---|
| laload | lstore | 44 | 13.41% |
| laload | lcmp | 36 | 10.98% |
| laload | aload_0 | 34 | 10.37% |
| laload | lastore | 32 | 9.76% |
| Instruction | Next | Count | Percent |
|---|---|---|---|
| land | lconst_0 | 133 | 24.54% |
| land | lstore | 56 | 10.33% |
| land | dup2 | 34 | 6.27% |
| land | lor | 33 | 6.09% |
| Instruction | Next | Count | Percent |
|---|---|---|---|
| lastore | dup | 103 | 37.32% |
| lastore | aload_0 | 55 | 19.93% |
| lastore | iinc | 39 | 14.13% |
| lastore | aastore | 20 | 7.25% |
| Instruction | Next | Count | Percent |
|---|---|---|---|
| lcmp | ifne | 496 | 24.63% |
| lcmp | ifeq | 436 | 21.65% |
| lcmp | ifge | 391 | 19.41% |
| lcmp | ifle | 286 | 14.20% |
| Instruction | Next | Count | Percent |
|---|---|---|---|
| lconst_0 | lcmp | 907 | 64.14% |
| lconst_0 | lstore | 76 | 5.37% |
| lconst_0 | invokespecial | 63 | 4.46% |
| lconst_0 | putfield | 54 | 3.82% |
| Instruction | Next | Count | Percent |
|---|---|---|---|
| lconst_1 | ladd | 143 | 25.09% |
| lconst_1 | lsub | 118 | 20.70% |
| lconst_1 | invokevirtual | 58 | 10.18% |
| lconst_1 | invokestatic | 39 | 6.84% |
| Instruction | Next | Count | Percent |
|---|---|---|---|
| ldc | invokevirtual | 4837 | 30.88% |
| ldc | invokespecial | 2696 | 17.21% |
| ldc | aastore | 1618 | 10.33% |
| ldc | invokestatic | 953 | 6.08% |
| Instruction | Next | Count | Percent |
|---|---|---|---|
| ldc2_w | lcmp | 474 | 16.14% |
| ldc2_w | land | 436 | 14.85% |
| ldc2_w | invokestatic | 328 | 11.17% |
| ldc2_w | ldiv | 164 | 5.58% |
| Instruction | Next | Count | Percent |
|---|---|---|---|
| ldc_w | aastore | 1073 | 49.36% |
| ldc_w | invokevirtual | 263 | 12.10% |
| ldc_w | iastore | 257 | 11.82% |
| ldc_w | getstatic | 123 | 5.66% |
| Instruction | Next | Count | Percent |
|---|---|---|---|
| ldiv | lreturn | 66 | 34.20% |
| ldiv | lstore | 28 | 14.51% |
| ldiv | l2i | 19 | 9.84% |
| ldiv | ladd | 15 | 7.77% |
| Instruction | Next | Count | Percent |
|---|---|---|---|
| lload | ldc2_w | 381 | 13.57% |
| lload | lload | 322 | 11.47% |
| lload | lcmp | 169 | 6.02% |
| lload | lconst_0 | 168 | 5.99% |
| Instruction | Next | Count | Percent |
|---|---|---|---|
| lload_0 | ldc2_w | 100 | 16.18% |
| lload_0 | invokestatic | 70 | 11.33% |
| lload_0 | lload_2 | 68 | 11.00% |
| lload_0 | bipush | 51 | 8.25% |
| Instruction | Next | Count | Percent |
|---|---|---|---|
| lload_1 | ldc2_w | 336 | 18.92% |
| lload_1 | invokevirtual | 263 | 14.81% |
| lload_1 | lconst_0 | 158 | 8.90% |
| lload_1 | aload_0 | 110 | 6.19% |
| Instruction | Next | Count | Percent |
|---|---|---|---|
| lload_2 | lload | 129 | 13.03% |
| lload_2 | invokestatic | 112 | 11.31% |
| lload_2 | invokevirtual | 91 | 9.19% |
| lload_2 | ldc2_w | 88 | 8.89% |
| Instruction | Next | Count | Percent |
|---|---|---|---|
| lload_3 | ldc2_w | 82 | 11.87% |
| lload_3 | lconst_0 | 77 | 11.14% |
| lload_3 | invokestatic | 50 | 7.24% |
| lload_3 | lload | 50 | 7.24% |
| Instruction | Next | Count | Percent |
|---|---|---|---|
| lmul | lstore | 43 | 16.93% |
| lmul | ladd | 33 | 12.99% |
| lmul | aload_0 | 26 | 10.24% |
| lmul | lload | 24 | 9.45% |
| Instruction | Next | Count | Percent |
|---|---|---|---|
| lneg | invokevirtual | 52 | 41.60% |
| lneg | aload_3 | 11 | 8.80% |
| lneg | l2i | 9 | 7.20% |
| lneg | invokestatic | 7 | 5.60% |
| Instruction | Next | Count | Percent |
|---|---|---|---|
| lookupswitch | aload_0 | 61 | 30.81% |
| lookupswitch | aload_2 | 23 | 11.62% |
| lookupswitch | iconst_1 | 15 | 7.58% |
| lookupswitch | ldc | 15 | 7.58% |
| Instruction | Next | Count | Percent |
|---|---|---|---|
| lor | lstore | 36 | 18.09% |
| lor | putstatic | 25 | 12.56% |
| lor | lconst_0 | 13 | 6.53% |
| lor | lstore_0 | 13 | 6.53% |
| Instruction | Next | Count | Percent |
|---|---|---|---|
| lrem | lconst_0 | 48 | 34.78% |
| lrem | ldc2_w | 24 | 17.39% |
| lrem | l2i | 19 | 13.77% |
| lrem | lstore | 9 | 6.52% |
| Instruction | Next | Count | Percent |
|---|---|---|---|
| lshl | invokestatic | 51 | 16.61% |
| lshl | ldc2_w | 38 | 12.38% |
| lshl | aload_0 | 33 | 10.75% |
| lshl | lor | 30 | 9.77% |
| Instruction | Next | Count | Percent |
|---|---|---|---|
| lshr | l2i | 29 | 36.25% |
| lshr | ldc2_w | 11 | 13.75% |
| lshr | lor | 6 | 7.50% |
| lshr | lstore | 6 | 7.50% |
| Instruction | Next | Count | Percent |
|---|---|---|---|
| lstore | lload | 494 | 33.22% |
| lstore | aload_0 | 205 | 13.79% |
| lstore | goto | 159 | 10.69% |
| lstore | aload | 68 | 4.57% |
| Instruction | Next | Count | Percent |
|---|---|---|---|
| lstore_0 | lload_0 | 38 | 77.55% |
| lstore_0 | goto | 2 | 4.08% |
| lstore_0 | iload_2 | 2 | 4.08% |
| lstore_0 | lload_2 | 2 | 4.08% |
| Instruction | Next | Count | Percent |
|---|---|---|---|
| lstore_1 | lload_1 | 101 | 48.10% |
| lstore_1 | aload_0 | 61 | 29.05% |
| lstore_1 | goto | 10 | 4.76% |
| lstore_1 | ldc2_w | 8 | 3.81% |
| Instruction | Next | Count | Percent |
|---|---|---|---|
| lstore_2 | lload_2 | 70 | 29.17% |
| lstore_2 | aload_0 | 43 | 17.92% |
| lstore_2 | lconst_0 | 24 | 10.00% |
| lstore_2 | aload_1 | 22 | 9.17% |
| Instruction | Next | Count | Percent |
|---|---|---|---|
| lstore_3 | lload_3 | 68 | 25.19% |
| lstore_3 | aload_0 | 65 | 24.07% |
| lstore_3 | goto | 36 | 13.33% |
| lstore_3 | lload_1 | 15 | 5.56% |
| Instruction | Next | Count | Percent |
|---|---|---|---|
| lsub | lstore | 163 | 26.72% |
| lsub | l2i | 62 | 10.16% |
| lsub | invokestatic | 61 | 10.00% |
| lsub | invokevirtual | 42 | 6.89% |
| Instruction | Next | Count | Percent |
|---|---|---|---|
| lushr | l2i | 69 | 27.82% |
| lushr | lstore | 53 | 21.37% |
| lushr | lxor | 25 | 10.08% |
| lushr | ldc2_w | 23 | 9.27% |
| Instruction | Next | Count | Percent |
|---|---|---|---|
| lxor | land | 22 | 27.85% |
| lxor | ldc2_w | 13 | 16.46% |
| lxor | l2i | 12 | 15.19% |
| lxor | lastore | 7 | 8.86% |
| Instruction | Next | Count | Percent |
|---|---|---|---|
| monitorenter | aload_0 | 718 | 67.42% |
| monitorenter | getstatic | 84 | 7.89% |
| monitorenter | aload_1 | 72 | 6.76% |
| monitorenter | new | 57 | 5.35% |
| Instruction | Next | Count | Percent |
|---|---|---|---|
| monitorexit | goto | 745 | 30.86% |
| monitorexit | aload | 575 | 23.82% |
| monitorexit | areturn | 321 | 13.30% |
| monitorexit | aload_3 | 246 | 10.19% |
| Instruction | Next | Count | Percent |
|---|---|---|---|
| multianewarray | areturn | 3 | 30.00% |
| multianewarray | astore | 3 | 30.00% |
| multianewarray | astore_1 | 2 | 20.00% |
| multianewarray | putstatic | 2 | 20.00% |
| Instruction | Next | Count | Percent |
|---|---|---|---|
| new | dup | 16337 | 100.00% |
| Instruction | Next | Count | Percent |
|---|---|---|---|
| newarray | dup | 431 | 31.19% |
| newarray | astore | 349 | 25.25% |
| newarray | putfield | 249 | 18.02% |
| newarray | astore_2 | 83 | 6.01% |
| Instruction | Next | Count | Percent |
|---|---|---|---|
| pop | aload_0 | 1281 | 24.04% |
| pop | goto | 928 | 17.41% |
| pop | aload_1 | 585 | 10.98% |
| pop | aload | 492 | 9.23% |
| Instruction | Next | Count | Percent |
|---|---|---|---|
| pop2 | aload_0 | 26 | 26.53% |
| pop2 | getstatic | 16 | 16.33% |
| pop2 | return | 9 | 9.18% |
| pop2 | aload_1 | 7 | 7.14% |
| Instruction | Next | Count | Percent |
|---|---|---|---|
| putfield | aload_0 | 8066 | 53.13% |
| putfield | return | 2827 | 18.62% |
| putfield | goto | 971 | 6.40% |
| putfield | aload_1 | 628 | 4.14% |
| Instruction | Next | Count | Percent |
|---|---|---|---|
| putstatic | new | 1255 | 37.38% |
| putstatic | return | 638 | 19.01% |
| putstatic | getstatic | 485 | 14.45% |
| putstatic | ldc | 159 | 4.74% |
| Instruction | Next | Count | Percent |
|---|---|---|---|
| saload | ldc | 76 | 34.70% |
| saload | sastore | 36 | 16.44% |
| saload | istore | 22 | 10.05% |
| saload | if_icmpge | 16 | 7.31% |
| Instruction | Next | Count | Percent |
|---|---|---|---|
| sastore | iinc | 48 | 38.40% |
| sastore | aload_0 | 42 | 33.60% |
| sastore | goto | 16 | 12.80% |
| sastore | iload | 8 | 6.40% |
| Instruction | Next | Count | Percent |
|---|---|---|---|
| sipush | ldc | 1124 | 17.35% |
| sipush | iastore | 913 | 14.09% |
| sipush | ldc_w | 910 | 14.05% |
| sipush | iand | 541 | 8.35% |
| Instruction | Next | Count | Percent |
|---|---|---|---|
| tableswitch | aload_0 | 110 | 31.98% |
| tableswitch | aload_1 | 33 | 9.59% |
| tableswitch | new | 28 | 8.14% |
| tableswitch | aload_3 | 18 | 5.23% |
Full data: Next Instruction Frequencies
Summary
Summary not conclusion, investigation not experiment.
This was a fun detour into bytecode but falls well short of the scientific method.
Hopefully you've found it interesting and maybe these tools can further your understanding of bytecode and how source code is translated into this funky little instruction set.
If you enjoyed it please follow @chriswhocodes on Twitter for more dives into the JVM :)
Further Work
- Generalising the JarScan tool is a new feature and I have ideas for several more static bytecode analyses.
- Implement following of invoke instruction flow.
- Code is not optimised. Parallel processing of bytecode would be nice.
- JarScan GUI?
- Re-run the investigation on a larger corpus of class files than just java.* from rt.jar